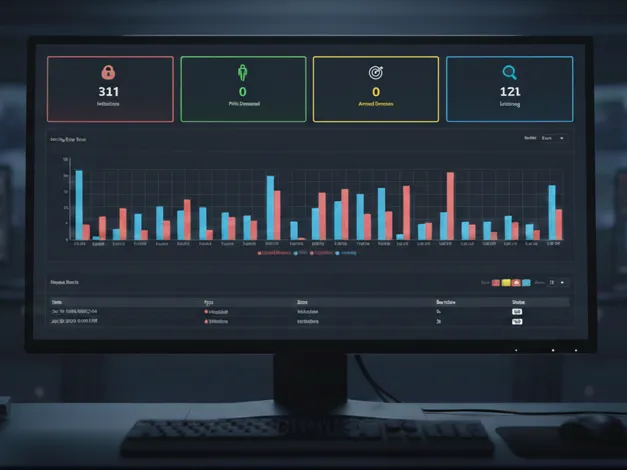
Dashboards for Business Intelligence
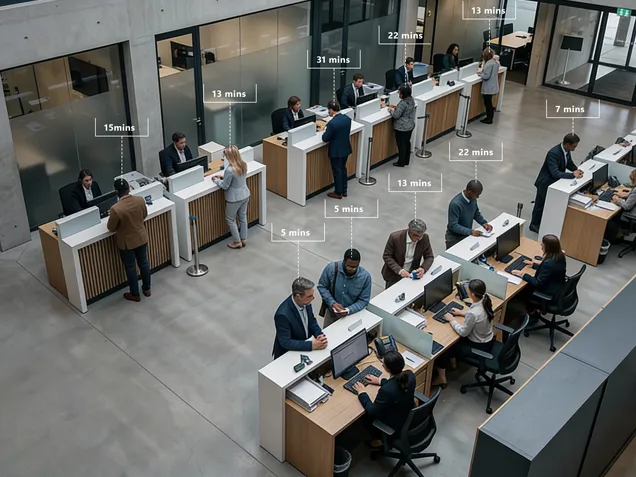
Your cameras record 24/7. CVEDIA turns video into structured metadata: now available in a built-in dashboard to monitor people flow, wait time, occupancy, and event trends across all cameras.
The Opportunity
Video surveillance generates continuous data. Most facilities extract nothing actionable from it.
Same infrastructure,new output
No new cameras and no rip and replace. Deploy on a server and extract usable metadata from existing video streams.
Standard data formats
REST APIs, database exports, and dashboard feeds. CVEDIA visualizes metadata through an intuitive dashboard experience, accessible via browser or natively embedded in your VMS.
Continuous extraction
Not periodic sampling or manual counts. Continuous, automated metadata extraction running 24/7 across all camera feeds.
From Camera to Dashboard
CVEDIA sits between your video infrastructure and your operational systems, translating visual data into structured metrics.
Camera Feeds
Existing surveillance cameras. Any resolution, any angle. No hardware changes required.
CVEDIA-RT
Real-time detection and classification. People, vehicles, zones, behaviors, all structured as data.
Structured Data
JSON streams, SQL exports, API endpoints. Standard formats your systems already speak.
Your Systems
BI platforms, dashboards, staffing models, facility planning tools. Video becomes operational data.
What We Measure
Transform video into structured operational metrics across traffic, queues, journeys, and efficiency.
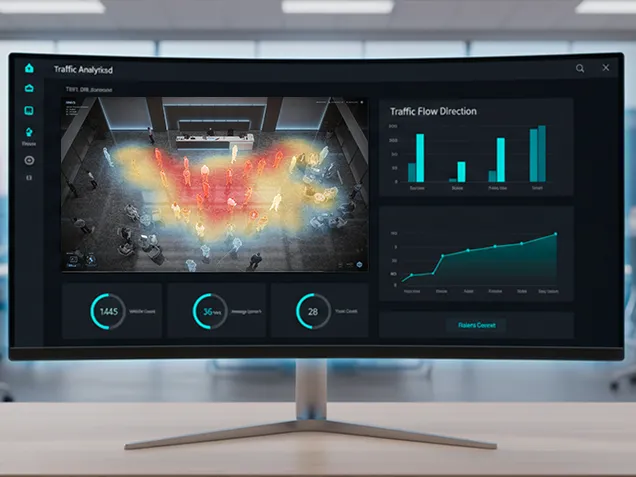
Footfall & Occupancy Metrics
Monitor footfall, occupancy, zone dwell time, and crowding across a site.
Core Detections
- Footfall counting with entry and exit tracking
- Zone occupancy: real-time and historical levels
- Crowd density: people per square meter calculation
- Zone dwell time, time spent in defined areas
Analytical Output
- Peak period identification and traffic patterns
- Capacity utilization percentages
- Flow rate/heatmaps, people per hour by zone
- Time-of-day trends: hourly, daily, weekly patterns

Want to see it in action?
Talk to our team about your BI requirements
Turn Passive Infrastructure Into Active Data
Traditional video systems record everything but extract nothing. CVEDIA transforms that passive infrastructure into an active data source, structured metrics your operational systems can use.
Our detection models are trained on the specific behaviors and scenarios relevant to business operations, not just security threats. The result is data you can actually act on: staffing decisions, layout improvements, service level optimization.
How to Deploy
CVEDIA AI Appliance
Pre-configured hardware for high-volume analytics processing with dashboard access and API integration built in.
Learn more →VMS Integration
Extract analytics from existing camera feeds through VMS plugins or CVEDIA-RT SDK integration with your current platform.
View options →Cloud Processing
Hybrid deployment with edge detection and cloud-based analytics aggregation, visualization, and multi-site reporting.
Documentation →Turn Video Into Operational Data
Your cameras are already running. Start extracting structured metrics your BI systems can use.